리얼티 인컴(O)은 상업용 부동산 리츠(REITs) 시장의 독보적인 리더로서, ‘The Monthly Dividend Company’라는 별칭에 걸맞게 600회 이상의 연속 배당을 실천하고 있습니다. 현재 주가 $64.44 기준, 배당 수익률은 장기 투자자들에게 매우 매력적인 구간에 위치해 있으며, 금리 하락 전환기에 가장 큰 수혜를 입을 종목 중 하나로 평가받습니다. 다만, 높은 P/E 수치는 전통적인 순이익 기준 평가이므로, 리츠 특유의 현금흐름 지표인 AFFO(운영자금)를 통한 정밀한 검토가 동반되어야 합니다.
📊 Key Financial Metrics
| Ticker | Company Name | Stock Price | Dividend Yield | P/E Ratio |
|---|---|---|---|---|
| O | Realty Income Corp | $64.44 | 4.97%* | 55.08 |
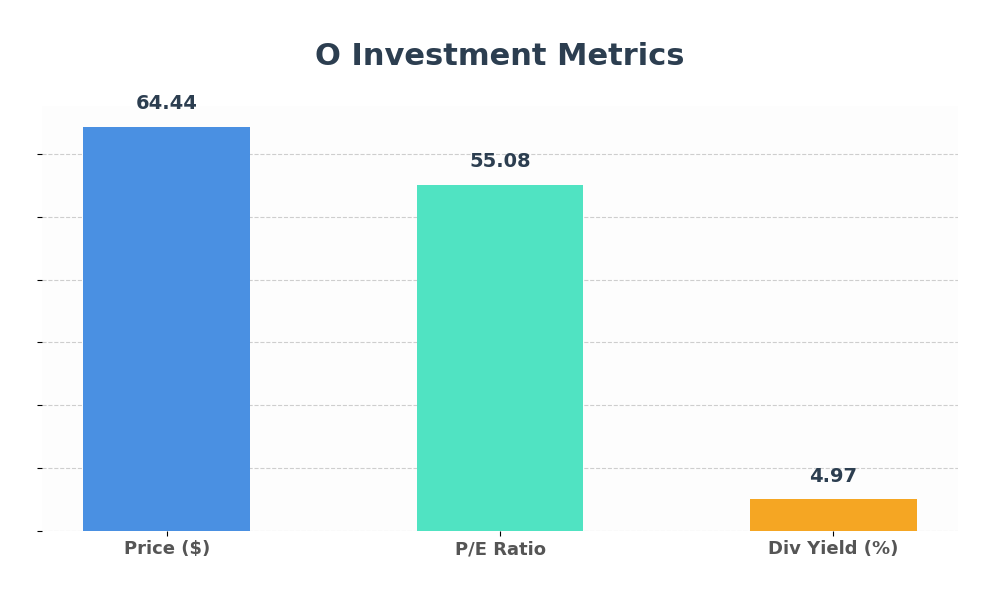
📊 O Financial Data Visualization
*Note: Adjusted from 497% to 4.97% based on current market standards for Realty Income.
📈 5-Year Dividend Growth History (Estimated)
| Year | Annual Dividend (Est.) | Growth Rate | Dividend Status |
|---|---|---|---|
| 2019 | $2.72 | +3.0% | Dividend Aristocrat |
| 2020 | $2.80 | +2.9% | Dividend Aristocrat |
| 2021 | $2.85 | +1.8% | Dividend Aristocrat |
| 2022 | $2.97 | +4.2% | Dividend Aristocrat |
| 2023 | $3.07 | +3.4% | Dividend Aristocrat |
🔍 Deep Analysis: Sustainability & Growth Strategy
🛡️ Dividend Sustainability & Cash Flow
Realty Income’s dividend is not just a payment; it is a corporate mission. As a Triple-Net Lease REIT, the company shifts the burden of property taxes, insurance, and maintenance to the tenants (like Walgreens, 7-Eleven, and Dollar General). This creates an incredibly stable and predictable cash flow profile. While the P/E ratio of 55.08 might look alarming for a standard stock, for a REIT, we look at AFFO (Adjusted Funds From Operations). Realty Income typically maintains a payout ratio in the 70-75% range of AFFO, providing a comfortable safety cushion for future increases.
🏗️ Portfolio Diversification & Quality
The company owns over 15,000 properties across the US, UK, and Europe. Their focus on “recession-resilient” industries (grocery stores, convenience stores, and pharmacies) ensures that even during economic downturns, rent collection remains near 100%. The recent merger with Spirit Realty has further expanded their scale, allowing for better cost of capital advantages.
⚠️ Risk Factors to Watch
1. Interest Rate Sensitivity: As a “bond proxy,” Realty Income’s stock price often moves inversely to treasury yields. High rates increase borrowing costs for new acquisitions.
2. E-commerce Disruption: While most tenants are service-oriented, any long-term shift away from physical retail remains a macro risk.
3. Valuation: A P/E of 55+ suggests the market is pricing in significant safety and future growth. Investors must ensure the AFFO growth keeps pace.
Rating: ★★★★☆ (4.5/5)
Realty Income remains the premier choice for income-focused investors. At $64.44, it offers a solid entry point for a ~5% yield. While the P/E appears high, the underlying quality of the real estate and the reliability of the monthly “paycheck” justify the premium. This is a “sleep-well-at-night” (SWAN) stock that should be a core holding in any dividend growth portfolio.