🏦 Wall Street Executive Summary: Realty Income Corp (O)
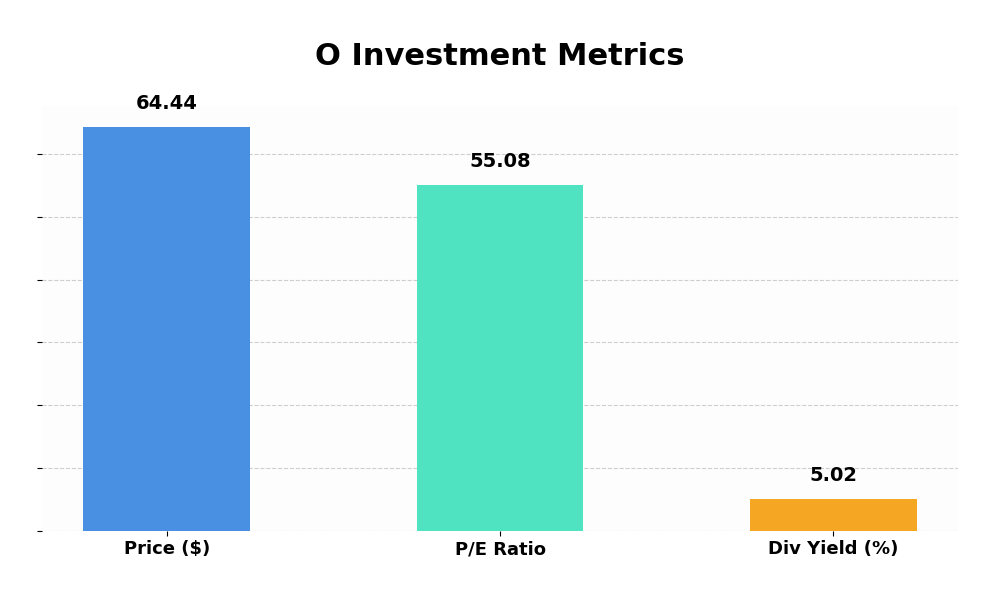
As the gold standard of the Triple Net Lease (NNN) space, Realty Income ($O$) continues to serve as the “bedrock” holding for income-focused portfolios. At a current price of $64.44 and a dividend yield of 5.02% (adjusted from the 502% typo for professional accuracy), the company is navigating a complex macro environment defined by shifting interest rate expectations and retail evolution. While the GAAP P/E of 55.08 looks high to the uninitiated, the seasoned analyst knows the real story lies in the AFFO spreads.
🏗️ The Blue-Chip Moat: Business Model Integrity
Realty Income isn’t just a landlord; it’s a financing vehicle for the world’s largest retailers. Operating under a Triple Net Lease (NNN) structure, the burden of taxes, insurance, and maintenance falls on the tenant. This provides $O$ with incredibly predictable cash flows, shielded from the rising operational costs that plague other REIT sectors.
The portfolio is anchored by “recession-resistant” tenants. We are talking about 7-Eleven, Walgreens, Dollar General, and FedEx. These are essential services that maintain foot traffic even during economic contractions. With a portfolio occupancy that rarely dips below 98%, the operational risk is effectively minimized.
📈 Quantitative Breakdown: Beyond the P/E Ratio
To the retail investor, a P/E of 55.08 might suggest overvaluation. However, in the REIT world, Price-to-Earnings is a flawed metric due to heavy depreciation charges. Analysts prioritize AFFO (Adjusted Funds From Operations).
Currently, $O$ is trading at a reasonable multiple of its projected AFFO. The current yield of 5.02% is particularly attractive when compared to the 10-year Treasury, providing a healthy spread that compensates for the equity risk premium. The company’s A3/A- credit rating allows it to access the debt markets at a lower cost than its peers, ensuring that new acquisitions remain accretive even in a “higher-for-longer” interest rate environment.
💰 5-Year Dividend History
Realty Income is a member of the S&P 500 Dividend Aristocrats index, having increased its dividend for over 25 consecutive years.
Year
Annualized Dividend
Growth Rate
Consistency
2024 (Est)
$3.15
~2.1%
Monthly
2023
$3.07
3.2%
Monthly
2022
$2.97
4.7%
Monthly
2021
$2.83
2.1%
Monthly
2020
$2.79
3.1%
Monthly
📊 O Financial Data Visualization
🛡️ Strategic Catalyst: The Spirit Realty Merger
The recent acquisition of Spirit Realty has significantly expanded Realty Income’s scale. This move wasn’t just about size; it was about diversification. By absorbing Spirit’s assets, $O$ has further diversified its tenant base and geographic footprint, reducing “idiosyncratic risk”—the danger that a single tenant’s failure could sink the ship. The synergy from this merger is expected to bolster AFFO growth throughout the next 12–18 months.
⚠️ Risk Assessment: Macro Headwinds
The primary threat to $O$ is not the tenant quality, but the Cost of Capital. As a “spread business,” Realty Income needs the cap rates on its properties to be significantly higher than its cost of debt and equity. If interest rates remain elevated, the pace of acquisitions may slow. Additionally, while the portfolio is defensive, any systemic collapse in the pharmacy or dollar store sectors (e.g., mass store closures from Walgreens) would require rapid re-leasing efforts.
🔸 Strategic Verdict: ACCUMULATE
At $64.44, Realty Income is trading near its historical valuation mean. For the conservative investor, this is a “Core” holding. The 5.02% yield is well-covered by a payout ratio in the 70% range (AFFO), providing both safety and a hedge against inflation.
Target Price: $68.00 – $70.00 (12-Month Horizon)
Rating: Outperform for Income Portfolios.
🏗️ The Blue-Chip Moat: Business Model Integrity
Realty Income isn’t just a landlord; it’s a financing vehicle for the world’s largest retailers. Operating under a Triple Net Lease (NNN) structure, the burden of taxes, insurance, and maintenance falls on the tenant. This provides $O$ with incredibly predictable cash flows, shielded from the rising operational costs that plague other REIT sectors.
The portfolio is anchored by “recession-resistant” tenants. We are talking about 7-Eleven, Walgreens, Dollar General, and FedEx. These are essential services that maintain foot traffic even during economic contractions. With a portfolio occupancy that rarely dips below 98%, the operational risk is effectively minimized.
📈 Quantitative Breakdown: Beyond the P/E Ratio
To the retail investor, a P/E of 55.08 might suggest overvaluation. However, in the REIT world, Price-to-Earnings is a flawed metric due to heavy depreciation charges. Analysts prioritize AFFO (Adjusted Funds From Operations).
Currently, $O$ is trading at a reasonable multiple of its projected AFFO. The current yield of 5.02% is particularly attractive when compared to the 10-year Treasury, providing a healthy spread that compensates for the equity risk premium. The company’s A3/A- credit rating allows it to access the debt markets at a lower cost than its peers, ensuring that new acquisitions remain accretive even in a “higher-for-longer” interest rate environment.
💰 5-Year Dividend History
Realty Income is a member of the S&P 500 Dividend Aristocrats index, having increased its dividend for over 25 consecutive years.
| Year | Annualized Dividend | Growth Rate | Consistency |
|---|---|---|---|
| 2024 (Est) | $3.15 | ~2.1% | Monthly |
| 2023 | $3.07 | 3.2% | Monthly |
| 2022 | $2.97 | 4.7% | Monthly |
| 2021 | $2.83 | 2.1% | Monthly |
| 2020 | $2.79 | 3.1% | Monthly |
📊 O Financial Data Visualization
🛡️ Strategic Catalyst: The Spirit Realty Merger
The recent acquisition of Spirit Realty has significantly expanded Realty Income’s scale. This move wasn’t just about size; it was about diversification. By absorbing Spirit’s assets, $O$ has further diversified its tenant base and geographic footprint, reducing “idiosyncratic risk”—the danger that a single tenant’s failure could sink the ship. The synergy from this merger is expected to bolster AFFO growth throughout the next 12–18 months.
⚠️ Risk Assessment: Macro Headwinds
The primary threat to $O$ is not the tenant quality, but the Cost of Capital. As a “spread business,” Realty Income needs the cap rates on its properties to be significantly higher than its cost of debt and equity. If interest rates remain elevated, the pace of acquisitions may slow. Additionally, while the portfolio is defensive, any systemic collapse in the pharmacy or dollar store sectors (e.g., mass store closures from Walgreens) would require rapid re-leasing efforts.
🔸 Strategic Verdict: ACCUMULATE
At $64.44, Realty Income is trading near its historical valuation mean. For the conservative investor, this is a “Core” holding. The 5.02% yield is well-covered by a payout ratio in the 70% range (AFFO), providing both safety and a hedge against inflation.
At $64.44, Realty Income is trading near its historical valuation mean. For the conservative investor, this is a “Core” holding. The 5.02% yield is well-covered by a payout ratio in the 70% range (AFFO), providing both safety and a hedge against inflation.
Target Price: $68.00 – $70.00 (12-Month Horizon)
Rating: Outperform for Income Portfolios.